
What you’ll learn
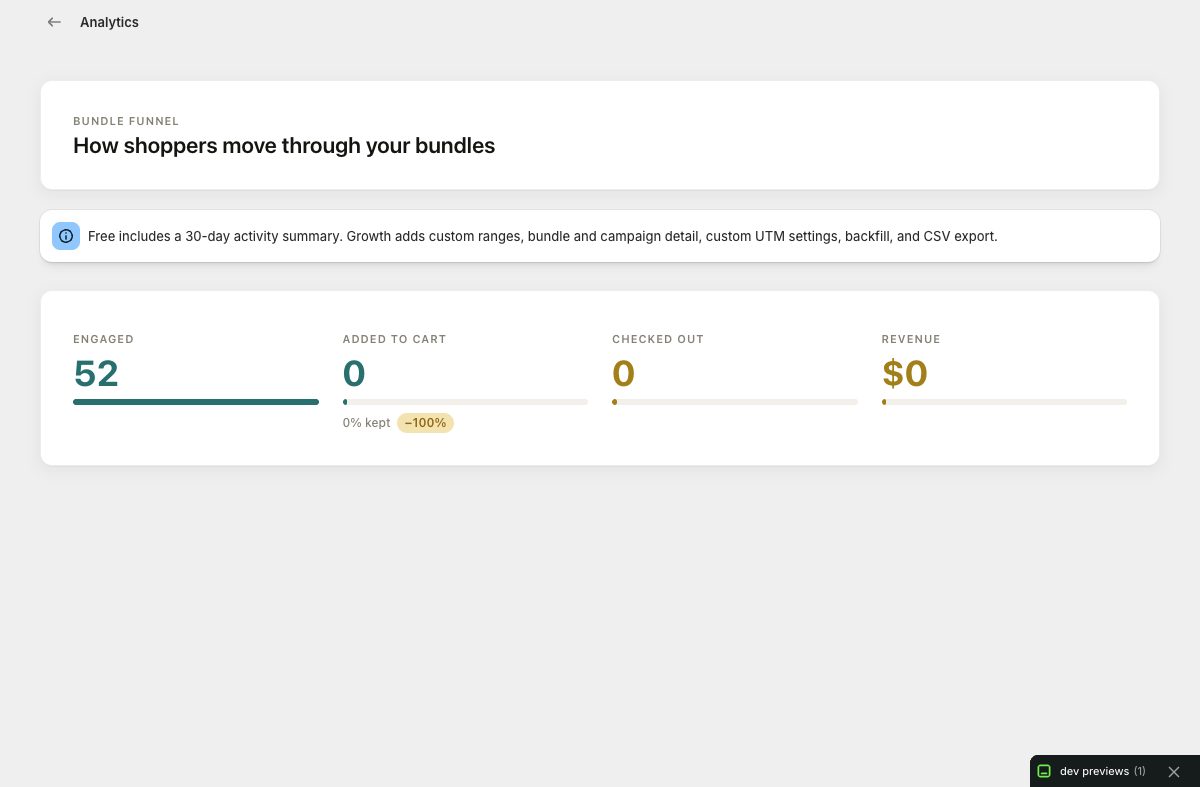
You will learn how to use Only Bundles Analytics to follow the customer journey from bundle view through engagement, successful add to cart, attributed order, and revenue. You will also learn how to choose a meaningful comparison window, separate bundle and campaign questions, and avoid drawing conclusions from incomplete traffic.
Analytics explain observed behavior; they do not prove why a customer acted. Use the funnel to identify where to investigate, then combine it with storefront review, offer context, and controlled changes.
Before you begin
Write down the bundle’s launch date, intended audience, placements, campaign links, and any changes to pricing or products. A reporting window that crosses a major redesign or discount change may combine two different experiences.
Confirm the bundle is actually reachable from the storefront or campaign being evaluated. Low conversions from a route with no meaningful traffic are a distribution issue, not evidence that the builder design failed.
Know the current reporting boundary. Free includes a 30-day aggregate analytics view. Growth adds broader analysis capabilities such as custom ranges, bundle and campaign detail, custom UTM workflows, backfill support, and CSV export. Treat the interface as the source for the features available to the store’s current plan.
1. Open Analytics and choose the question
Open Analytics from Only Bundles navigation. Begin with one question, such as:
- Are shoppers who see the bundle beginning to interact?
- Do engaged shoppers complete the selection rule?
- Do completed bundles reach Shopify cart?
- Are added bundles becoming attributed orders?
- Did one campaign or bundle improve after a specific change?
Without a defined question, it is easy to scan every card and mistake normal variation for an actionable problem.
2. Read the funnel in order
Start at bundle views, then move through engagement and successful add-to-cart activity toward attributed orders and revenue. Use consistent denominators when calculating progression. A fall between two stages is most useful when those stages represent the same cohort and date range.
A high number of views with little engagement suggests the offer, placement, loading, or first instruction needs investigation. Strong engagement with weak add-to-cart may point to impossible rules, unclear progress, variant availability, pricing surprise, or a crowded summary. Healthy add-to-cart with weak attributed orders can involve cart, checkout, traffic quality, or the time lag between visit and purchase.
Do not interpret a raw count without its upstream exposure. Ten orders may be excellent from one hundred qualified visits and weak from ten thousand.
3. Choose a reporting window
Use the shortest window that contains enough representative traffic and includes the change you are evaluating. For a steady evergreen bundle, a 30-day aggregate can smooth daily noise. For a short campaign, align the range with the actual campaign dates.
Avoid comparing a holiday week with an ordinary week without noting the context. Record product stockouts, theme changes, price changes, and traffic-source shifts. Those conditions can move the funnel even when the bundle configuration did not change.
Growth custom ranges can isolate pre-change and post-change periods. Keep the duration and weekday mix similar when practical.
4. Compare bundles for a reason
Bundle-level detail is most helpful when the offers share a useful comparison basis. A guided gift box and a small product-page add-on may naturally have different behavior because customer intent and placement differ.
Compare like with like: two product-page offers on similar products, two versions of a guided journey, or the same bundle before and after one deliberate change. Note the bundle type, traffic source, selection complexity, discount, and average merchandise value.
If one bundle underperforms, open its live storefront on desktop and mobile. Reproduce the stage where the funnel weakens instead of immediately changing the template.
5. Evaluate campaigns and custom UTMs
When using campaign detail or custom UTM parameters, give each link a stable purpose. Use a naming convention that identifies channel, campaign, and creative without exposing customer data. Do not create a new UTM for every casual share; fragmented naming makes comparison harder.
Verify the final shared URL before launch and click it in a fresh browser. A correct parameter on a broken or redirected bundle link will not create useful evidence. Compare campaigns on qualified traffic and customer intent, not click volume alone.
6. Understand attribution boundaries
Attributed orders and revenue connect bundle interactions to commerce outcomes through the app’s supported attribution path. They should be read as Only Bundles reporting evidence, not as a universal replacement for Shopify reports or an ad platform’s attribution model.
Different systems can use different windows and rules. When figures differ, document the definition and time range before calling one incorrect. Shopify remains authoritative for orders and financial records; the bundle report adds the offer-level context needed to improve the experience.
7. Use backfill and exports responsibly
If Growth exposes backfill for the store, use it to recover supported historical reporting after confirming the requested period and expected source data. Do not assume backfill can invent events that were never collected.
CSV export is useful for retained analysis, joins with approved merchant data, and sharing with authorized teammates. Store exports securely because they can contain sensitive commercial information. Keep the export date, filters, and range alongside any derived dashboard.
8. Turn a finding into one test
Choose one change connected to the weak stage. Examples include shortening the first instruction, reducing required choices, clarifying the next discount threshold, changing a product-page placement, or removing an unnecessary upsell.
Record the change time, avoid simultaneous unrelated edits, and let the new experience collect representative traffic. Then compare the same metrics and storefront conditions. This creates a learning loop instead of a series of untraceable redesigns.
Troubleshooting
The dashboard is empty. Confirm the bundle was live and reachable during the selected period. Check whether the current plan and date range expose the expected detail.
Views rise but engagement does not. Open the exact placement and verify loading, first-screen instructions, eligibility, and mobile presentation. Also review whether campaign traffic expected a different offer.
Add-to-cart looks healthy but orders are low. Verify Shopify cart correctness, selling plans, discounts, stock, shipping expectations, and checkout handoff. Allow for the normal time between cart and order.
Two reports show different revenue. Align date range, timezone, currency presentation, attribution definition, and order status before comparing them.
A CSV total differs from the screen. Recheck the export filters and whether the dashboard changed after export. Preserve the export timestamp with your analysis.
Analytics review checklist
Define the question, use one coherent date range, read the funnel in order, compare genuinely similar offers, verify findings in the live storefront, and change one meaningful variable at a time. The purpose of analytics is not to reward every metric increase; it is to make the next bundle decision more informed.